From the bronze age to the iron age, metals have defined eras of human history. If our current era had to be defined similarly, it would undoubtedly be known as the steel age.
Steel is the foundation of our buildings, vehicles, and industries, with its rates of production and consumption often seen as markers for a nation’s development. Today, it is the world’s most commonly used metal and most recycled material, with 1,864 million metric tons of crude steel produced in 2020.
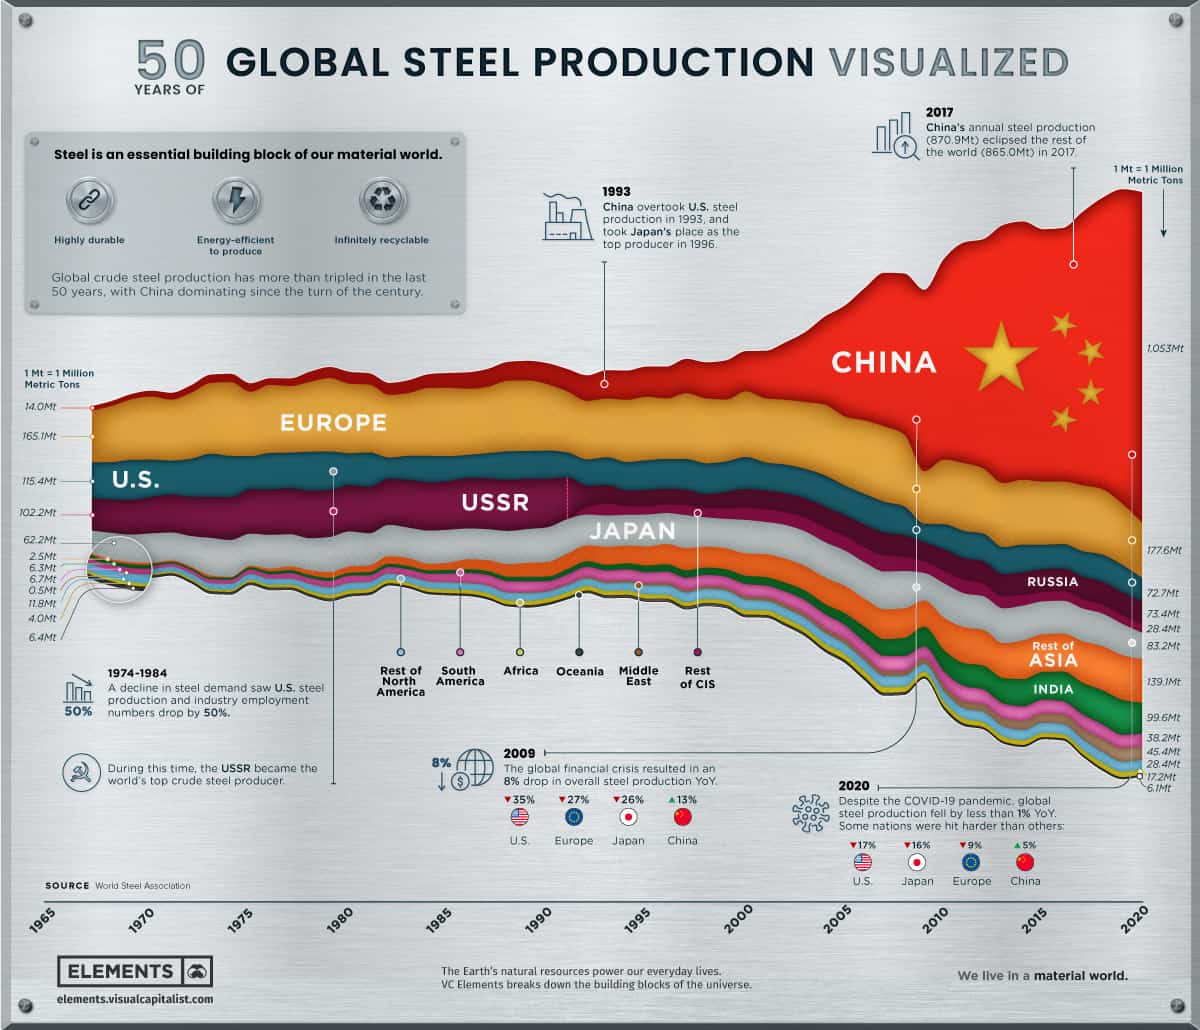
This infographic uses data from the World Steel Association to visualize 50 years of crude steel production, showcasing our world’s unrelenting creation of this essential material.
The State of Steel Production
Global steel production has more than tripled over the past 50 years, despite nations like the U.S. and Russia scaling down their domestic production and relying more on imports. Meanwhile, China and India have consistently grown their production to become the top two steel producing nations.
Below are the world’s current top crude steel producing nations by 2020 production.
| Rank | Country | Steel Production (2020, Mt) |
|---|---|---|
| #1 |  China China |
1,053.0 |
| #2 |  India India |
99.6 |
| #3 |  Japan Japan |
83.2 |
| #4 |  Russia* Russia* |
73.4 |
| #5 |  United States United States |
72.7 |
| #6 |  South Korea South Korea |
67.1 |
| #7 |  Turkey Turkey |
35.8 |
| #8 |  Germany Germany |
35.7 |
| #9 |  Brazil Brazil |
31.0 |
| #10 |  Iran* Iran* |
29.0 |
Source: World Steel Association. *Estimates.
Despite its current dominance, China could be preparing to scale back domestic steel production to curb overproduction risks and ensure it can reach carbon neutrality by 2060.
As iron ore and steel prices have skyrocketed in the last year, U.S. demand could soon lessen depending on the Biden administration’s actions. A potential infrastructure bill would bring investment into America’s steel mills to build supply for the future, and any walkbalk on the Trump administration’s 2018 tariffs on imported steel could further soften supply constraints.
Steel’s Secret: Infinite Recyclability
Made up primarily of iron ore, steel is an alloy which also contains less than 2% carbon and 1% manganese and other trace elements. While the defining difference might seem small, steel can be 1,000x stronger than iron.
However, steel’s true strength lies in its infinite recyclability with no loss of quality. No matter the grade or application, steel can always be recycled, with new steel products containing 30% recycled steel on average.
The alloy’s magnetic properties make it easy to recover from waste streams, and nearly 100% of the steel industry’s co-products can be used in other manufacturing or electricity generation.
It’s fitting then that steel makes up essential parts of various sustainable energy technologies:
- The average wind turbine is made of 80% steel on average (140 metric tons).
- Steel is used in the base, pumps, tanks, and heat exchangers of solar power installations.
- Electrical steel is at the heart of the generators and motors of electric and hybrid vehicles.
The Steel Industry’s Future Sustainability
Considering the crucial role steel plays in just about every industry, it’s no wonder that prices are surging to record highs. However, steel producers are thinking about long-term sustainability, and are working to make fossil-fuel-free steel a reality by completely removing coal from the metallurgical process.
While the industry has already cut down the average energy intensity per metric ton produced from 50 gigajoules to 20 gigajoules since the 1960s, steel-producing giants like ArcelorMittal are going further and laying out their plans for carbon-neutral steel production by 2050.
Steel consumption and demand is only set to continue rising as the world’s economy gradually reopens, especially as Rio Tinto’s new development of atomized steel powder could bring about the next evolution in 3D printing.
As the industry continues to innovate in both sustainability and usability, steel will continue to be a vital material across industries that we can infinitely recycle and rely on.
Steel Prices: Short Term Inflation, Long Term Deflation
Last time out, we looked at the price of Lithium-Ion batteries — they cost 97% less than they did 3 decades ago (Deflation, Punctuated by Spasms of Inflation).
Along the same lines, consider Steel: The industrial metal has not had that sort of price movement, but it has dramatically lagged global price increases.
In 1965, 4 regions accounted for most of the production by tonnage — Europe, USA, USSR, and Japan — were nearly 90% of all steel produced. 55 years later, one nation dominates nearly half of all steel produced: China.
They did not get to that level of market share because it’s a superior product — it is essentially a commodity — they got there through relentless cost-cutting and government-subsidized production. Buyers do not care, cheaper steel costs mean lower input costs that gives them more flexibility with their margins.
The last 20 years have seen this key industrial metal lag CPI inflation substantially. The recent spike in prices is fighting against a lot of history.
I am not a fan of posting every chart that confirms my views, so instead, I will link to two others you might find interesting: See YCharts for 1990-2021 of Steel vs CPI costs; and the “Price History, Tables and Charts” at Steel benchmarked, for what looks like deflation with spasms of inflation.